In a year characterised by the health emergency and the social and economic crisis generated by the Covid-19 pandemic, the Group achieved solid and resilient econom- ic and financial performance.
The negative variance that emerges when comparing 2019 results is primarily attributable to the significant decline in operations in the sec- ond quarter of the year.
Total net debt/(fund)
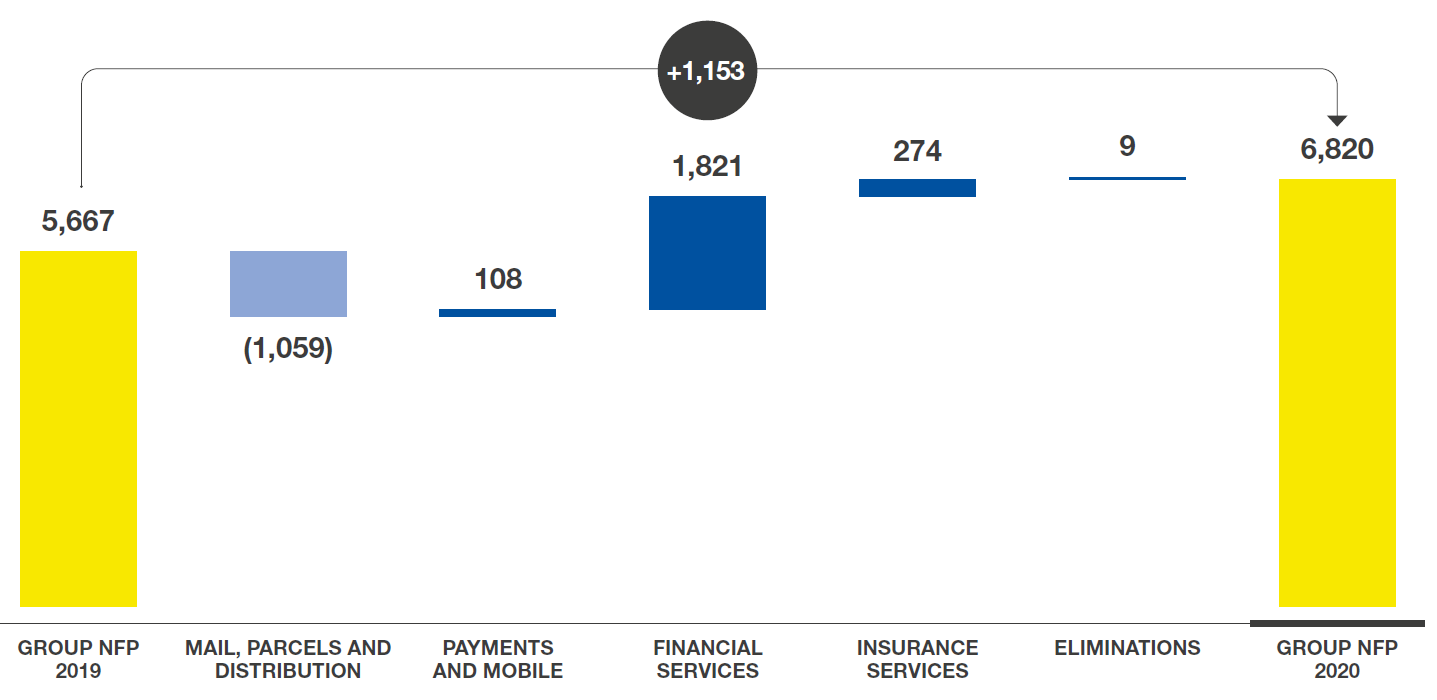
Total net debt/(funds) at 31 December 2020 showed funds of €6,820 million, up €1,153 million from 31 December 2019 (€5,667 million). This change was primarily attributable to positive operating income of €2.1 billion (including €1,206 million attributable to profit for the period) and the increase in the fair value of investments classified as FVTOCI held by the Financial Services SBU relating to the portion not hedged by fair value hedges amounting to €1.7 billion, partially offset by the negative change in working capital of about €1 billion, investments for €680 million and the distribution of dividends totalling €613 million.
Consolidated financial statements
Consolidated statement of financial position
| Assets (€m) | Notes | 31 December 2020 | of which related parties | 31 December 2019 | of which related parties |
| Non-current assets | |||||
| Property, plant and equipment | [A1] | 2,134 | – | 2.015 | – |
| Investment property | [A2] | 31 | – | 44 | – |
| Intangible assets | [A3] | 755 | – | 648 | – |
| Right-of-use assets | [A4] | 1,200 | – | 1.254 | – |
| Investments accounted for using the equity method | [A5] | 615 | 615 | 617 | 617 |
| Financial assets | [A6] | 217,877 | 3,879 | 194,207 | 4,522 |
| Trade receivables | [A8] | 2 | – | 5 | – |
| Deferred tax assets | [C13] | 1,123 | – | 1,199 | – |
| Other receivables and assets | [A9] | 3,868 | 2 | 3,729 | 1 |
| Technical provisions attributable to reinsurers | 54 | – | 58 | – | |
| Total | 227,659 | 203,776 | |||
| Current assets | |||||
| Inventories | [A7] | 165 | – | 140 | – |
| Trade receivables | [A8] | 2,373 | 582 | 2,166 | 664 |
| Current tax assets | [C13] | 187 | – | 52 | – |
| Other receivables and assets | [A9] | 1,060 | 3 | 938 | 2 |
| Financial assets | [A6] | 30,006 | 7,617 | 23,569 | 7,220 |
| Cash and deposits attributable to BancoPosta | [A10] | 6,391 | – | 4,303 | – |
| Cash and cash equivalents | [A11] | 4,516 | 1,992 | 2,149 | 495 |
| Total | 44,698 | 33,317 | |||
| Total assets | 272,357 | 237,093 |
| Liabilities and equity | Notes | 31 December 2020 | of which related parties | 31 December 2019 | of which related parties |
| Equity | |||||
| Share capital | [B2] | 1,306 | – | 1,306 | – |
| Reserves | [B4] | 3,909 | – | 2,646 | – |
| Treasury shares | (40) | – | (40) | – | |
| Retained earnings | 6,327 | – | 5,786 | – | |
| Total equity attributable to owners of the Parent | 11,502 | 9,698 | |||
| Equity attributable to non-controlling interests | 5 | – | 0 | – | |
| Total | 11,507 | 9,698 | |||
| Non-current liabilities | |||||
| Technical provisions for insurance business | [B5] | 153,794 | – | 140,261 | – |
| Provisions for risks and charges | [B6] | 625 | 59 | 501 | 58 |
| Employee termination benefits | [B7] | 1,030 | – | 1.135 | – |
| Financial liabilities | [B8] | 18,366 | 241 | 13,964 | 132 |
| Deferred tax liabilities | [C13] | 1,229 | – | 887 | – |
| Other liabilities | [B10] | 1,576 | – | 1.525 | – |
| Total | 176,620 | 158,273 | |||
| Current liabilities | |||||
| Provisions for risks and charges | [B6] | 771 | 13 | 717 | 12 |
| Trade payables | [B9] | 1,837 | 56 | 1,627 | 98 |
| Current tax liabilities | [C13] | 13 | – | 274 | – |
| Other liabilities | [B10] | 1,745 | 74 | 2,110 | 74 |
| Financial liabilities | [B8] | 79,864 | 4,373 | 64,394 | 4,820 |
| Total | 84,230 | 69,122 | |||
| Total liabilities and equity | 272,357 | 237,093 |
Consolidated statement of profit or loss
| (€m) | Notes | FY 2020 | of which related parties | FY 2019 | of which related parties |
| Revenue from Mail, Parcels and other | [C1] | 3,201 | 400 | 3,492 | 498 |
| Revenue from Payments and Mobile | [C2] | 737 | 48 | 664 | 59 |
| Net revenue from Financial Services | [C3] | 4,945 | 2.017 | 5,134 | 1,993 |
| Revenue from Financial Services | 5,151 | 2.022 | 5,213 | 1,998 | |
| Expenses from financial activities | (206) | (5) | (79) | (5) | |
| Revenue from Insurance Services after changes in technical provisions and other claim expenses | [C4] | 1,643 | 15 | 1,669 | 16 |
| Insurance premium revenue | 16,865 | – | 17,913 | – | |
| Income from insurance activities | 4,065 | 15 | 5,478 | 16 | |
| Change in technical provisions for insurance business and other claim expenses | (18,767) | – | (21,463) | – | |
| Expenses from insurance activities | (520) | – | (259) | – | |
| Net operating revenue | 10,526 | 10,959 | |||
| Cost of goods and services | [C5] | 2,523 | 159 | 2,287 | 169 |
| Personnel expenses | [C6] | 5,638 | 75 | 5,896 | 50 |
| Depreciation, amortisation and impairments | [C7] | 700 | – | 774 | – |
| Capitalised costs and expenses | [C8] | (37) | – | (31) | – |
| Other operating costs | [C9] | 103 | 3 | 200 | 3 |
| Impairment losses/(reversals of impairment losses) on debt instruments, receivables and other assets | [C10] | 75 | 2 | 59 | – |
| Operating profit/(loss) | 1,524 | 1,774 | |||
| Finance costs | [C11] | 75 | 3 | 73 | 2 |
| Finance income | [C11] | 123 | – | 105 | – |
| Impairment losses/(reversals of impairment losses) on financial assets | [C12] | 1 | – | 46 | – |
| of which, non-recurring costs/(income) | – | 46 | |||
| Profit/(Loss) on investments accounted for using the equity method | [A5] | 5 | – | 112 | – |
| of which, non-recurring income (costs) | – | 88 | |||
| Profit/(Loss) before tax | 1,576 | 1,872 | |||
| Income tax expense | [C13] | 370 | – | 530 | – |
| of which, non-recurring costs/(income) | (96) | – | |||
| Net profit for the year | 1,206 | 1,342 | |||
| of which attributable to owners of the Parent | 1,207 | 1,342 | |||
| of which attributable to non-controlling interests | (1) | – | |||
| Earnings per share | [B1] | 0.927 | 1.032 | ||
| Diluted earnings per share | 0.927 | 1.032 |
Consolidated statement of comprehensive income
| (€m) | Notes | FY 2020 | FY 2019 |
| Profit/(Loss) for the year | 1,206 | 1,342 | |
| Items to be reclassified in the Statement of profit or loss for the year | |||
| FVOCI debt instruments | |||
| Increase/(decrease) in fair value during the year | [tab. B4] | 2,016 | 1,767 |
| Transfers to profit or loss | [tab. B4] | (263) | (244) |
| Increase/(decrease) for expected losses | 7 | (2) | |
| Cash flow hedges | |||
| Increase/(decrease) in fair value during the year | [tab. B4] | (28) | 95 |
| Transfers to profit or loss | [tab. B4] | 5 | (59) |
| Taxation of items recognised directly in, or transferred from, equity to be reclassified in the Statement of profit or loss for the year | (495) | (445) | |
| Share of after-tax comprehensive income/(loss) of investees accounted for using equity method | – | (1) | |
| Items not to be reclassified in the Statement of profit or loss for the year | |||
| FVOCI equity instruments | |||
| Increase/(decrease) in fair value during the period | 17 | 1 | |
| Transfers to equity | – | – | |
| Actuarial gains /(losses) on employee termination benefits | [tab. B7] | (5) | (70) |
| Taxation of items recognised directly in, or transferred from, equity not to be reclassified in the Statement of profit or loss for the year | 1 | 20 | |
| Share of after-tax comprehensive income/(loss) of investees accounted for using equity method | – | – | |
| Total other comprehensive income | 1,255 | 1,062 | |
| TOTAL COMPREHENSIVE INCOME FOR THE YEAR | 2,461 | 2,404 | |
| of which attributable to owners of the Parent | 2,462 | 2,404 | |
| of which attributable to non-controlling interests | (1) | – |
Consolidated statement of changes in equity
| (milioni di euro) | Equity | |||||||||||
| Share capital | Treasury shares | Reserves | Retained earnings | Total equity attributable to owners of the Parent | Equity attributable to non- controlling interests | Total equity | ||||||
| Legal reserve | BancoPosta il Patrimonio BancoPosta | Fair value reserve | Cash flow hedge reserve | Reserve for investees accounted for using equity method | Incentive plans reserve | |||||||
| Balance at 1 January 2019 | 1,306 | – | 299 | 1,210 | (69) | 89 | 2 | – | 5,268 | 8,105 | – | 8.105 |
| Total comprehensive income for the year | – | – | – | – | 1,087 | 26 | (1) | – | 1,292 | 2,404 | – | 2.404 |
| Incentive plans | – | – | – | – | – | – | – | 2 | – | 2 | – | 2 |
| Dividends paid | – | – | – | – | – | – | – | – | (574) | (574) | – | (574) |
| Interim dividend | – | – | – | – | – | – | – | – | (200) | (200) | – | (200) |
| Other changes | – | (40) | – | – | – | – | 1 | – | – | (39) | – | (39) |
| Balance at 31 December 2019 | 1,306 | (40) | 299 | 1,210 | 1,018 | 115 | 2 | 2 | 5,786 | 9,698 | – | 9.698 |
| Total comprehensive income for the year | – | – | – | – | 1,276 | (17) | – | – | 1,203* | 2,462 | (1) | 2.461 |
| Dividends paid | – | – | – | – | – | – | – | – | (402) | (402) | – | (402) |
| Interim dividend | – | – | – | – | – | – | – | – | (211) | (211) | – | (211) |
| Transactions with minority shareholders | – | – | – | – | – | – | – | – | (49) | (49) | – | (49) |
| Incentive plans | – | – | – | – | – | – | – | 4 | – | 4 | – | 4 |
| Change in scope of consolidation | – | – | – | – | – | – | – | – | – | – | 6 | 6 |
| Balance at 31 December 2020 | 1,306 | (40) | 299 | 1,210 | 2,294 | 98 | 2 | 6 | 6,327 | 11,502 | 5 | 11.507 |
* This item includes profit for the year (Group portion) of €1,207 million and actuarial losses on provisions for employee termination benefits of €4 million, after the related current and deferred taxation.
Consolidated statement of cash flows
| (€m) | Notes | FY 2020 | FY 2019 |
| Cash and cash equivalents at beginning of year | 2,149 | 3,195 | |
| Profit/(Loss) before tax | 1,576 | 1,872 | |
| Depreciation, amortisation and impairments | [tab. C7] | 700 | 774 |
| Goodwill impairment | [tab. A3] | – | – |
| Net provisions for risks and charges | [tab. B6] | 566 | 394 |
| Use of provisions for risks and charges | [tab. B6] | (388) | (696) |
| Provisions for employee termination benefits | [tab. B7] | 2 | 1 |
| Employee termination benefits | [tab. B7] | (120) | (140) |
| (Gains)/Losses on disposals | (2) | 1 | |
| Impairment losses/(reversals of impairment losses) on financial assets | [tab. C12] | – | 46 |
| (Dividends) | [tab. C11.1] | – | – |
| Dividends received | – | – | |
| (Finance income realised) | [tab. C11.1] | (1) | (7) |
| (Finance income in form of interest) | [tab. C11.1] | (108) | (94) |
| Interest received | 112 | 95 | |
| Interest expense and other finance costs | [tab. C11.2] | 62 | 68 |
| Interest paid | (28) | (23) | |
| Losses and impairment losses/(reversals of impairment losses) on receivables | [tab. C10] | 61 | 62 |
| Income tax paid | [tab. C13.3] | (823) | (252) |
| Other changes | 7 | (104) | |
| Cash flow generated by operating activities before movements in working capital | [a] | 1,616 | 1,997 |
| Movements in working capital: | |||
| (Increase)/decrease in Inventories | [tab. A7] | (26) | (4) |
| (Increase)/decrease in Trade receivables | (262) | (40) | |
| (Increase)/decrease in Other receivables and assets | (162) | (16) | |
| Increase/(decrease) in Trade payables | 209 | 43 | |
| Increase/(decrease) in Other liabilities | (436) | (197) | |
| Cash flow generated by /(used in) movements in working capital | [b] | (677) | (214) |
| Increase/(decrease) in liabilities attributable to financial activities, payments, cards and acquiring and insurance | 14,469 | 7,980 | |
| Net cash generated by/(used for) financial assets attributable to financial activities, payments, cards and acquiring and insurance | (15,961) | (10,904) | |
| (Increase)/decrease in cash and deposits attributable to BancoPosta | [tab. A10] | (2,088) | (984) |
| Increase/(decrease) in net technical provisions for insurance business | 7,813 | 7,456 | |
| (Income)/Expense and other non-cash components | (3,255) | (4,211) | |
| Cash generated by/(used for) financial assets/liabilities attributable to financial activities, payments, cards and acquiring and insurance | [c] | 978 | (663) |
| Net cash flow from /(for) operating activities | [d]=[a+b+c] | 1,917 | 1,120 |
| of which related party transactions | (39) | 248 | |
| Investing activities: | |||
| Property, plant and equipment | [tab. A1] | (300) | (391) |
| Investment property | [tab. A2] | (1) | (1) |
| Intangible assets | [tab. A3] | (379) | (342) |
| Investments | (1) | (15) | |
| Other financial assets | (35) | (17) | |
| Disinvestimenti: | |||
| Property, plant and equipment, investment property, intangible assets and assets held for sale | 6 | 4 | |
| Investments | – | 1 | |
| Other financial assets | 109 | 29 | |
| Net cash flow from /(for) investing activities | [e] | (601) | (732) |
| of which related party transactions | (28) | 3 | |
| Proceeds from/(Repayments of) long-term borrowings | [tab. B8.4] | 1,248 | 573 |
| (Increase)/decrease in loans and receivables | – | – | |
| Increase/(decrease) in short-term borrowings | [tab. B8.4] | 415 | (1,193) |
| (Purchase)/sale of treasury shares | – | (40) | |
| Dividends paid | [B3] | (613) | (774) |
| Other transactions with minority shareholders | 1 | – | |
| Net cash flow from/(for) financing activities and shareholder transactions | [f] | 1,051 | (1,434) |
| of which related party transactions | (388) | (492) | |
| Net increase/(decrease) in cash | [g]=[d+e+f] | 2,367 | (1,046) |
| Cash and cash equivalents at end of year | [tab. A11] | 4,516 | 2,149 |
| Cash and cash equivalents at end of year | [tab. A11] | 4,516 | 2,149 |
| Restricted cash and cash equivalents at end of year | (1,705) | (884) | |
| Unrestricted cash and cash equivalents at end of year | 2,811 | 1,265 |
 © Poste Italiane 2025 - VAT number: 01114601006